US housing: soft or hard landing?
As underlined by the Dallas Federal Reserve (Fed) last week, the US housing market is showing signs of “brewing a housing bubble”. House prices are 20% higher than in the same period in 2021. The low level of housing inventories – linked in part to pandemic shortages - should maintain pressure on housing prices in 2022, but the Fed is increasingly worried that the evolution of prices is now detached from fundamentals. The current spike in mortgage rates will weigh on already stretched consumers, but this may be considered a welcome phenomenon to rein in housing demand.
US house prices are booming
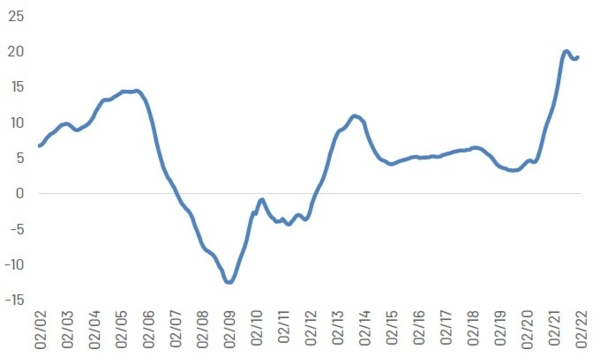
According to the S&P Case Shiller index, US house prices increased by 19.2% in January on an annual basis (+1.6% on a monthly basis), with prices in 12 of the 20 cities monitored progressing with double-digit growth. Even if the rate of growth of these prices appears to be gradually moderating since August 2021, they remain at historically high rates (see Chart 1).
Chart 1: US house prices - S&P case shiller index, year-on-year, %
Source: S&P Case Shiller, Indosuez Wealth Management
Lagging housing supply a supporting factor for prices
US housing market supply has been tight for years notably due to structural shortages in entry level supply (see Global Outlook 2022 - US Housing No Shelter from High Prices). Furthermore, these imbalances may have been affected by the pandemic. Supply-chain disruptions slowed construction and housing completions, while the current surge in input costs (notably lumber and steel) has also weighed on construction sentiment. Labour shortages have recovered, however, with the number of employees in the construction sector back to pre-pandemic levels.
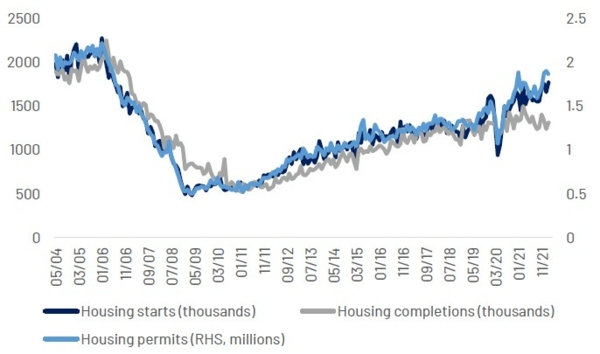
Low supply in the face of rising demand has translated into a depletion in housing inventories – a key metric to watch. According to the National Association of Realtors, the number of existing homes unsold has dropped to historical lows, with approximately 870,000 houses currently for sale in the U.S., compared to 2 million prior to the crisis. In February 2022, 84% of homes sold were on the market for less than a month. Housing permits are up 10% over the year and 30% compared to 2020, but have never recovered to 2007 levels (see Chart 2). Housing completions continue to lag housing starts.
Looking ahead, we see housing supply as continuing to maintain pressure on prices, but it does not explain the exponential price rise, especially with the expected drop in demand in 2022.
Chart 2: US housing construction data
Source: US Census, Indosuez Wealth Management
Higher mortgage rates will rein in demand
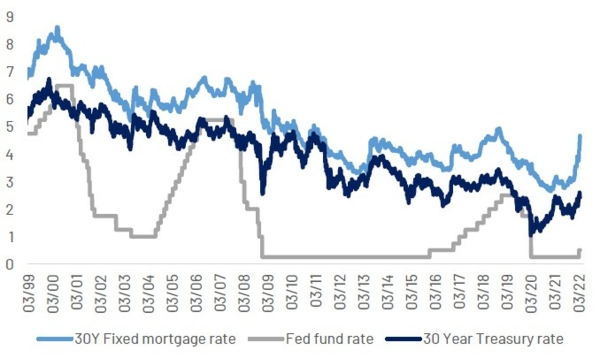
US mortgage rates have been pointing up since the beginning of 2021, increasing rapidly as of January 2022 as lenders anticipate the Fed’s upcoming hikes (see Chart 3). The US 30 year mortgage fixed interest rate is at 4.67% (up 156 basis points since 31.12.2021), its highest since December 2018. The spread vs. the US 30 year Treasury rate is also significantly wider (230 basis points vs. 184 in February 2019). These new rates are higher than real estate experts had projected: Freddie Mac 2022 average yearly interest rate projection: 3.6%. In this context, demand for adjustable rates (ARM) is once again rising (+ 26% vs. 2021) as a 5/1 ARM (initial rate set for five years) has a rate of 3.5% today.
Chart 3: US 30-year fixed mortgage, 30-year treasury & fed funds rates, %
Source: Refinitiv, Freddie Mac, Indosuez Wealth Management
Historically - since the mid-1980s - such a sharp increase of fixed mortgage rates (>100 basis points) has only occurred a handful of times (see Table 1). The rate increase led systematically to a fall in demand, but did not have any direct repercussions on overall prices in the six months post rate hike. Interest rates are pushed up when the economy is overheating (in other words doing well). This has an impact on housing demand which in turn slows the rapid pace of prices. But historically, prices have not fallen and are more sensitive to economic slowdowns or tight lending policies. Nevertheless, the comparison of housing prices with rising mortgage rates in past cycles could be affected by the starting point of yields in the cycle. Hence, prices could be more vulnerable today after multi-decade long compressed yields.
Table 1: tracing the impact of mortgage rate hikes
| 3 month increase in fixed 30Y mortgage rate (basis points) | Lag on the fall in demand | Overall drop in housing demand 6 months post rate shock | Change in house prices 6 months after | |
| Spring 1987 | 140 | 3 months | -11% | +4% |
| Spring 1994 | 107 | 1 month | -9% | +1% |
| Fall 2003 | 108 | 1 month | -1% | +6% |
| Summer 2013 | 106 | 2 months | -4% | +5% |
Source: Refinitiv, S&P Case-Shiller, Indosuez Wealth Management
The US is indeed already starting to see an impact on housing demand:
- The affordability index dropped 4 percentage points in January (mostly in the northeast and the west of the USA).
- Existing home sales dropped 7% in the US on a monthly basis in February (to 6.02 million, below the market forecasts of 6.1 million) and new home sales dropped 2%.
- The NAHB Housing index that surveys single family sales conditions fell 5 points from December 2021 to March 2022, mainly due to a 15 point fall in the “expectations in the next 6 months” component of the index, “the current traffic of prospective buyers” component having fallen only 4 points.
- The BH&J Buy vs. Rent index indicates that it is more interesting to rent today than to buy in the US, despite the rent price rising (see next section).
Caution - house prices becoming detached from fundamentals
All in all, the hike in mortgage rates is cooling US housing demand, but historically there is no indication that it will weigh on housing prices in the current context.
Supply side factors can explain a part of the increase in housing prices, but the Dallas Fed underlines there is a part of the market that cannot be explained by fundamentals.
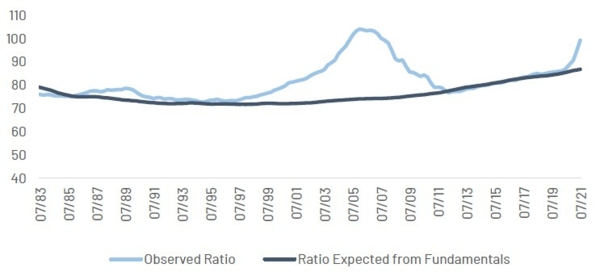
The Fed chart below (Chart 4) portrays how the theoretical value of housing based on the sum of discounted future rents (the house-to-rent ratio)1 does not explain the current rise in prices. This is despite a sharp rise in rents, due in part to the end of the COVID-linked rent moratorium period. According to the CoreLogic single-family rental index, rents grew 12.6% year on year in January 2021, with Miami leading the way with a 40% increase.
A rapid rise in home values doesn't necessarily signal a bubble, but the Dallas Fed monitor has warned that the current price rises are out of step with market fundamentals since Q3 20212. This is not just for the US, however, as the Fed has identified this issue in a number countries. The global increases in part reflect the pandemic response of governments and central banks, which boosted income and lowered borrowing costs through fiscal transfers and monetary policy accommodation. As these effects recede, so should the increase in prices dampen.
However, the stark increase in the role of investors in the US housing market can also explain this price phenomenon. According to Redfin real estate market data, investors bought a record-high 18.4% of the US homes purchased in Q4 2021, with mid & low-priced homes representing 69% of investor purchases.
Chart 4: Fed price-to-rent ratio: actual vs. fundamentals based
Source: Dallas Fed, Indosuez Wealth Management
2022 is not 2008
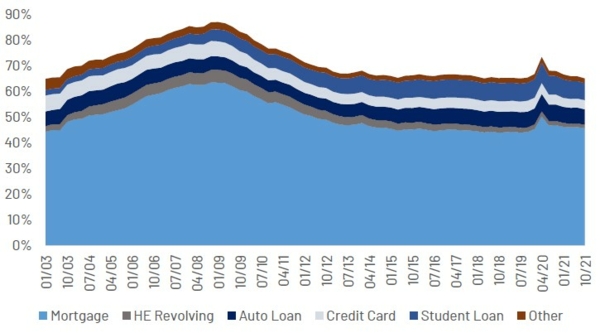
US households are in considerably better shape today than at the dawn of the 2008 financial crisis. Banks have been more conservative in their lending and household debt is lower (at 65% of GDP) compared to 2008 (at 85%, see Chart 5) and the proportion of US home owners with mortgages set at adjustable interest rates - a key vulnerability factor during the 2008 crisis has also fallen to under 10% of the population (compared to approximately 35% in 2008). The household savings rate is also higher (at 6% compared to 4% in 2008).
Nevertheless, consumers are facing other challenges:
- negative real wage growth: consumer price inflation being up 7.9% in February, compared to wage growth of 5%;
- for first-time buyers (representing 29% of sales in February 2022), who face the double challenge of rising rates and house prices (+19% in January, see Chart 5) ;
- the national median mortgage payment applied for applicants rose 20% in February 2022 compared to the same period in 2021 (Mortgage Bankers Association);
- the savings buffer accumulated during the pandemic has now dissipated as the rate is now in line with its pre-crisis average (6%).
All in all, this is not 2008. A hard landing is not on the cards because consumer balance sheets are not the same (excessive borrowing is not behind the rise in prices), consumer vulnerability to variable mortgages rates is significantly lower, housing supply is historically low, but a soft landing cannot be ruled out in the short-term because mortgages rates are heading north and consumers are under significant pressure. The role of investors in the housing market and the supply in the lower to middle end of the housing market are elements to watch.
Chart 5: US household debt, % of GDP
Source: New York Fed, Indosuez Wealth Management
1- Based on a set variables (disposable income, housing rents, long-term rates).
2- Dallas Federal Reserve, 29 March 2022 US Housing Prices report. This monitor tracks "exuberance," that is when prices increase at an exponential rate that cannot be justified by economic fundamentals. When the indicator is above the 95% confidence threshold it is considered significant, the measure is currently at 115%.
April 06, 2022

